- Energized
- Posts
- ⚡Crude Gains as Car Tariffs Hit Equities
⚡Crude Gains as Car Tariffs Hit Equities
Plus, perspective on the growth US LNG exports
March 28, 2025
Morning everyone,
Economic data came in ok, with both jobless claims and GDP data a bit better than expectations. Equity markets were lower, however, due to the fact that any historical data will be taken with a grain of salt in a world where the future is so uncertain.
Of course, we got a bit more certainty on auto tariffs, and it feels like this one is going to stick.
What's in this issue:
Energy Market Recap
EIA Nat Gas Inventories
Growth in US LNG Exports
Headlines
| Crude Oil (May) | $69.92 | +0.27 | +0.39% |
| Natural Gas (Apr) | $3.925 | +0.053 | +1.37% |
| Copper (May) | $5.1195 | -0.1235 | -2.36% |
| S&P 500 | 5,693.31 | -18.89 | -0.33% |
| Dollar Index (DX) | 103.99 | -0.22 | -0.21% |
Energy Markets
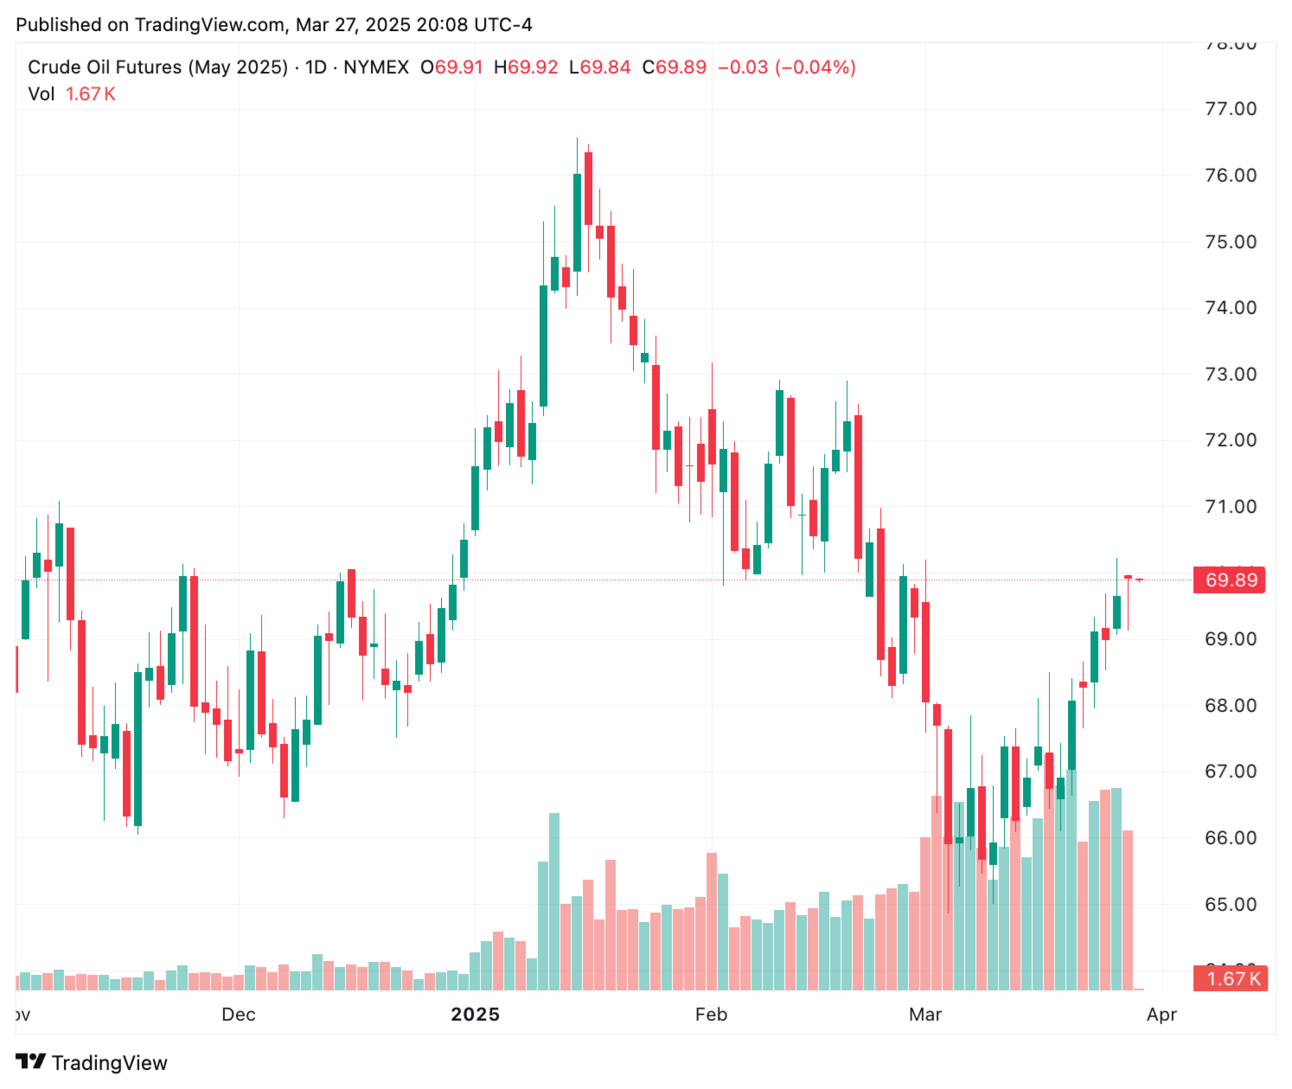
🛢️WTI ended the day higher by .39%, continuing the move higher but bumping into resistance at $70.
While the rally has been driven by a combination of covering due to technical support at $64, threats to Mexican and Canadian oil supplies, and now tariffs on Venezuela, concerns for demand destruction from a slowing economy are seen as capping gains.
All of this has been happening against a bearish picture of predicted supply overhangs for 2025, OPEC+ raising quotas, and continued weakness out of China.
WTI Spreads
May/June: +0.43
Jun/Dec: +2.83
Dec5/Dec6: +2.01
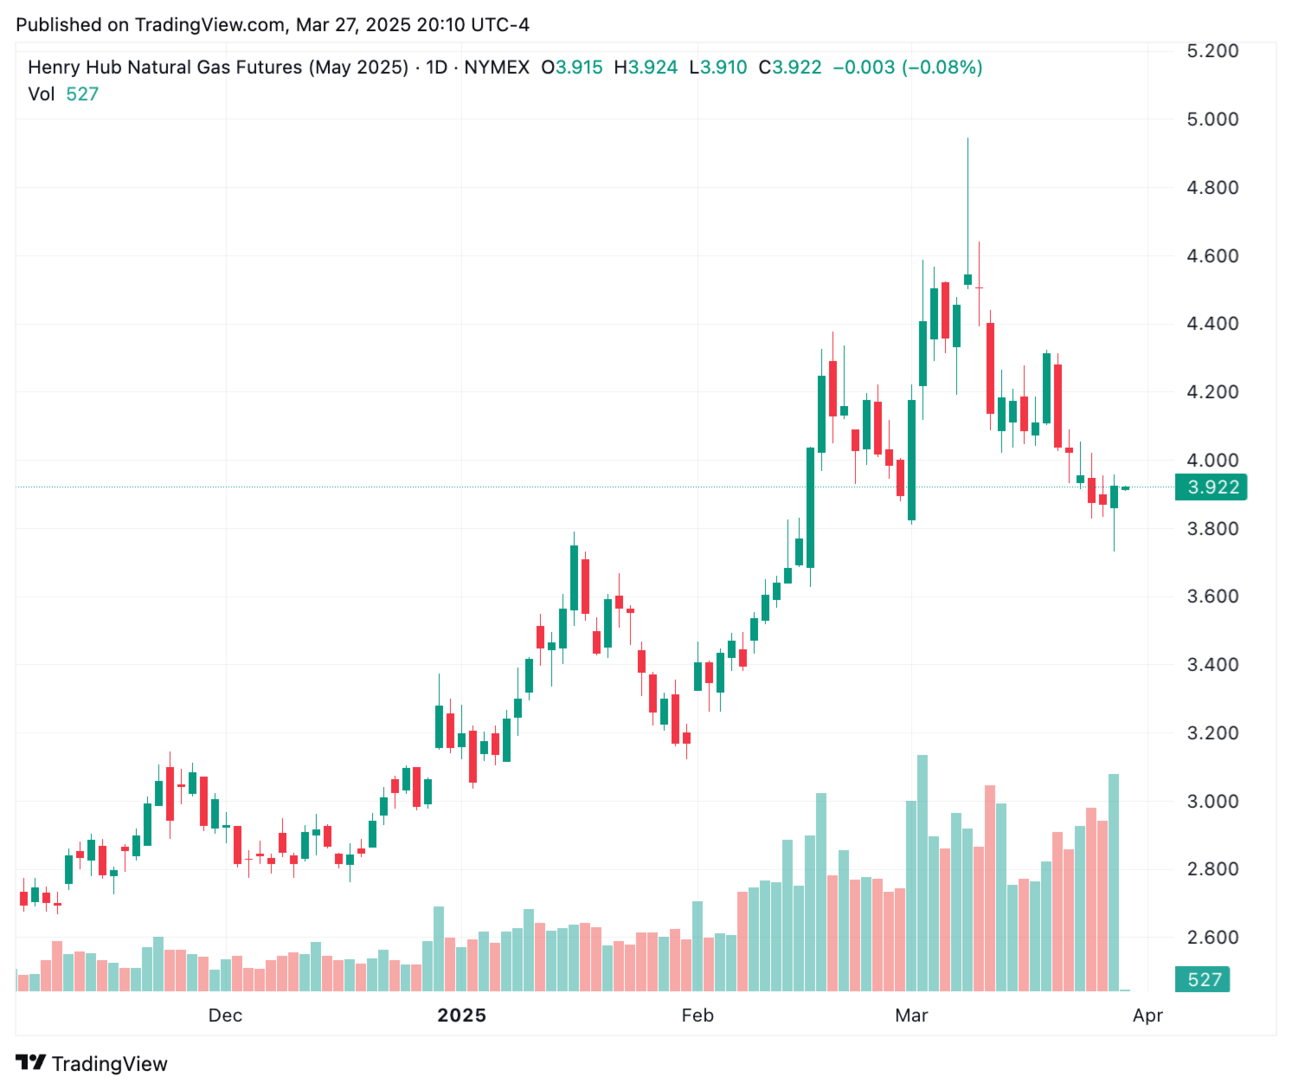
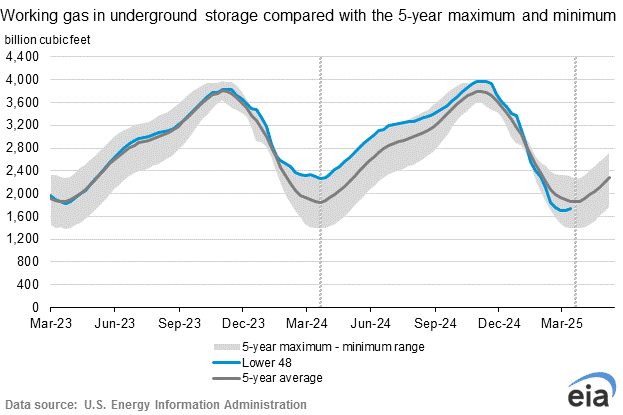
🔥 Natural gas was in ‘buy the dip’ mode after initially selling off on a larger than expected build in inventories. April contract ended up higher by 1.37% as it went off the board.
The EIA reported a build of 37bcf versus expectations for a build of 26bcf.
The report states that:
“Stocks were 557 Bcf less than last year at this time and 122 Bcf below the five-year average of 1,866 Bcf.”
PRESENTED BY ENERGY 101

From oil and gas to power and renewables, we have you covered. Groups of ten or more? We can create a custom course from over 50 available course modules to suit your needs.
US LNG Growth
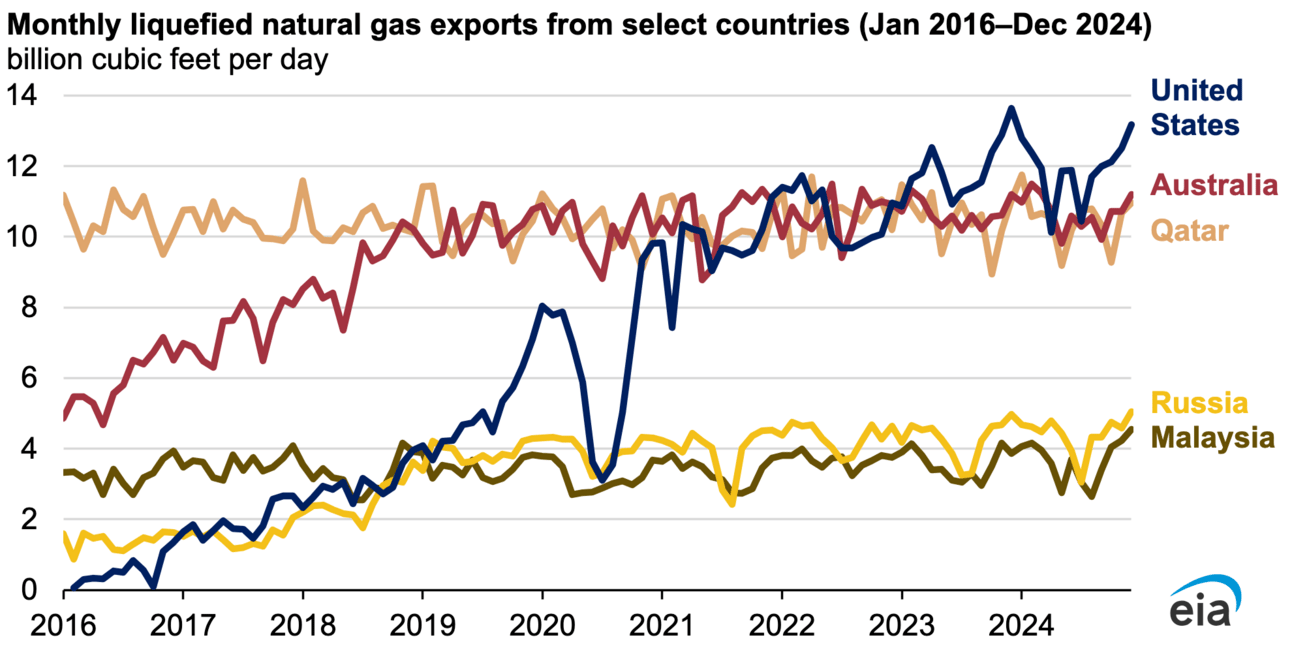
The US LNG export story has been well tracked recently, but its always interesting to get perspective on just how a trend came together, and how rapid the growth has been.
In its latest Today in Energy report, the EIA highlights that the US remained the largest LNG exporter in 2024.
“The United States exported 11.9 billion cubic feet per day (Bcf/d) of liquefied natural gas (LNG) in 2024, remaining the world’s largest LNG exporter. LNG exports from Australia and Qatar—the world’s two next-largest LNG exporters—have remained relatively stable over the last five years (2020–24)”
To me, the graph showing the starting point of zero in 2016 is the real story.
Headlines
The company plans to apply under the Deep Seabed Hard Mineral Resources Act of 1980 (DSHMRA) instead of the International Seabed Authority (ISA), stating the latter had not yet adopted regulations around deep seabed exploitation.
+The Metals Company to apply for deep sea exploration license under US legislation - Reuters
The move comes amid an unfavorable environment for renewable power investments in Brazil, where projects have struggled to be implemented due to oversupply of energy, a slow growth in demand and regulatory questions.
+Shell scraps solar, onshore wind power projects in Brazil - Reuters
“Brussels has launched a drive to remove layers of bureaucracy that European businesses say set them at a disadvantage against China and the United States, where the Trump administration is aggressively rolling back regulation.”
+EU targeting energy laws in drive to cut red tape, sources say - Reuters
Economic Calendar
Monday -
Tuesday - Home price index, New home sales, Consumer confidence
Wednesday - Crude Oil Storage Report, Durable goods
Thursday - Natural Gas Storage Report, Jobless Claims, GDP
Friday - Consumer sentiment