- Energized
- Posts
- ⚡Inventory Build Season
⚡Inventory Build Season
Plus, a long look at crude prices.
February 6, 2025

PRESENTED BY: ENERGY 101
Gold continues to set records and copper has joined the party on tariffs. A 2% move may be everyday volatility for crude and nat gas, but for copper this was a huge move.
Employment data came in strong - 183k vs expectations of 176k. Job market looking strong so far this year. Of course, the chaotic political environment makes it hard to plan day to day much less medium-long term at the moment.
What's in this issue:
Energy Market Recap
A Long View
Headlines
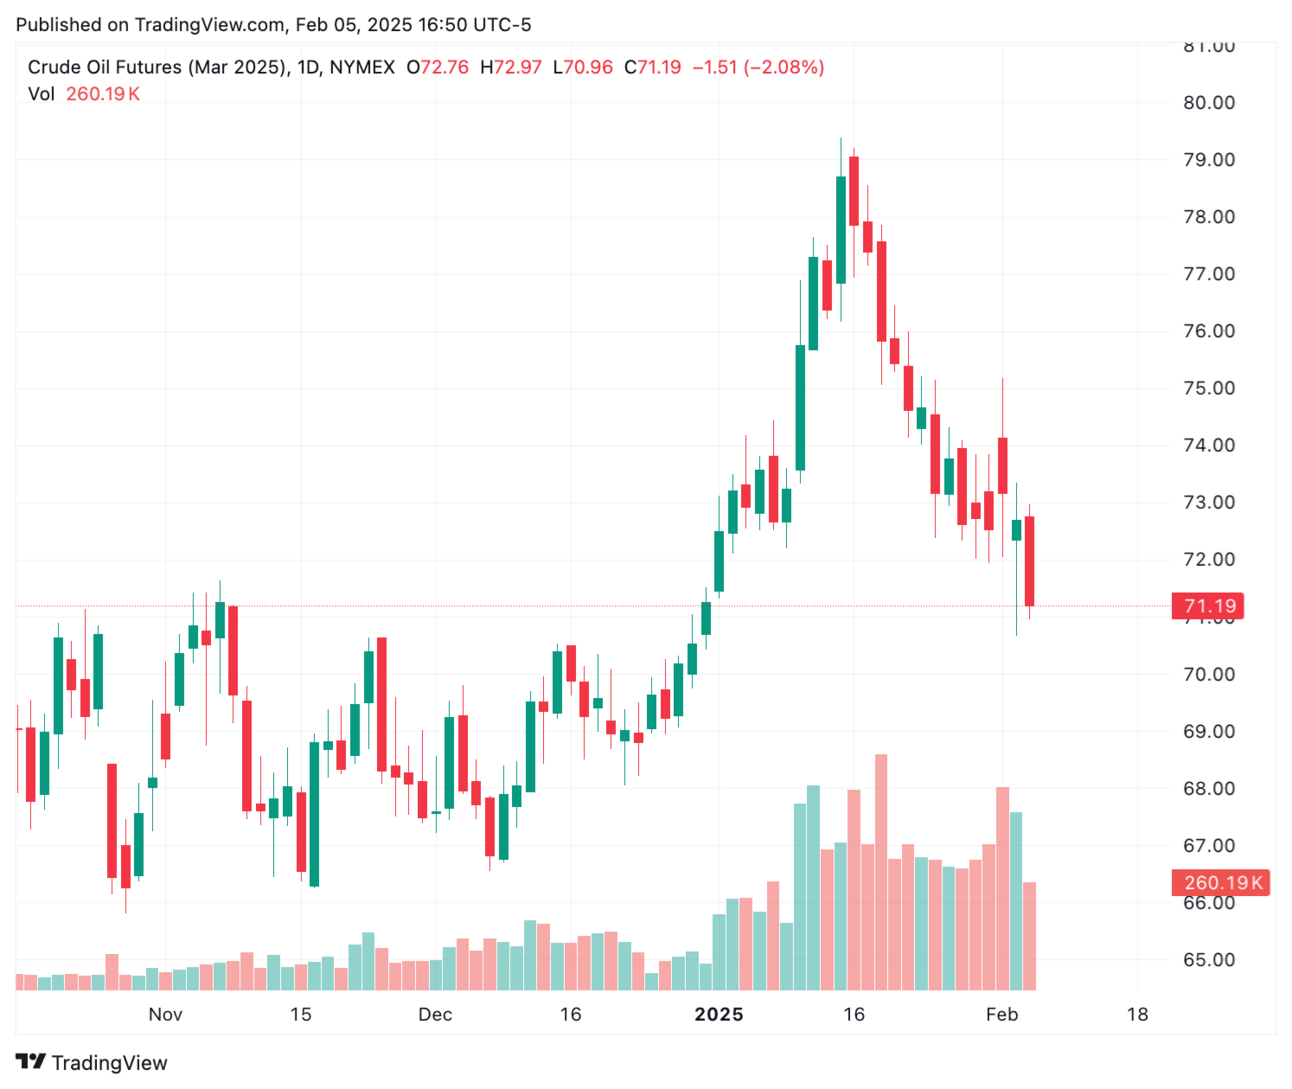
| Crude Oil (Mar) | $71.03 | -1.67 | -2.30% |
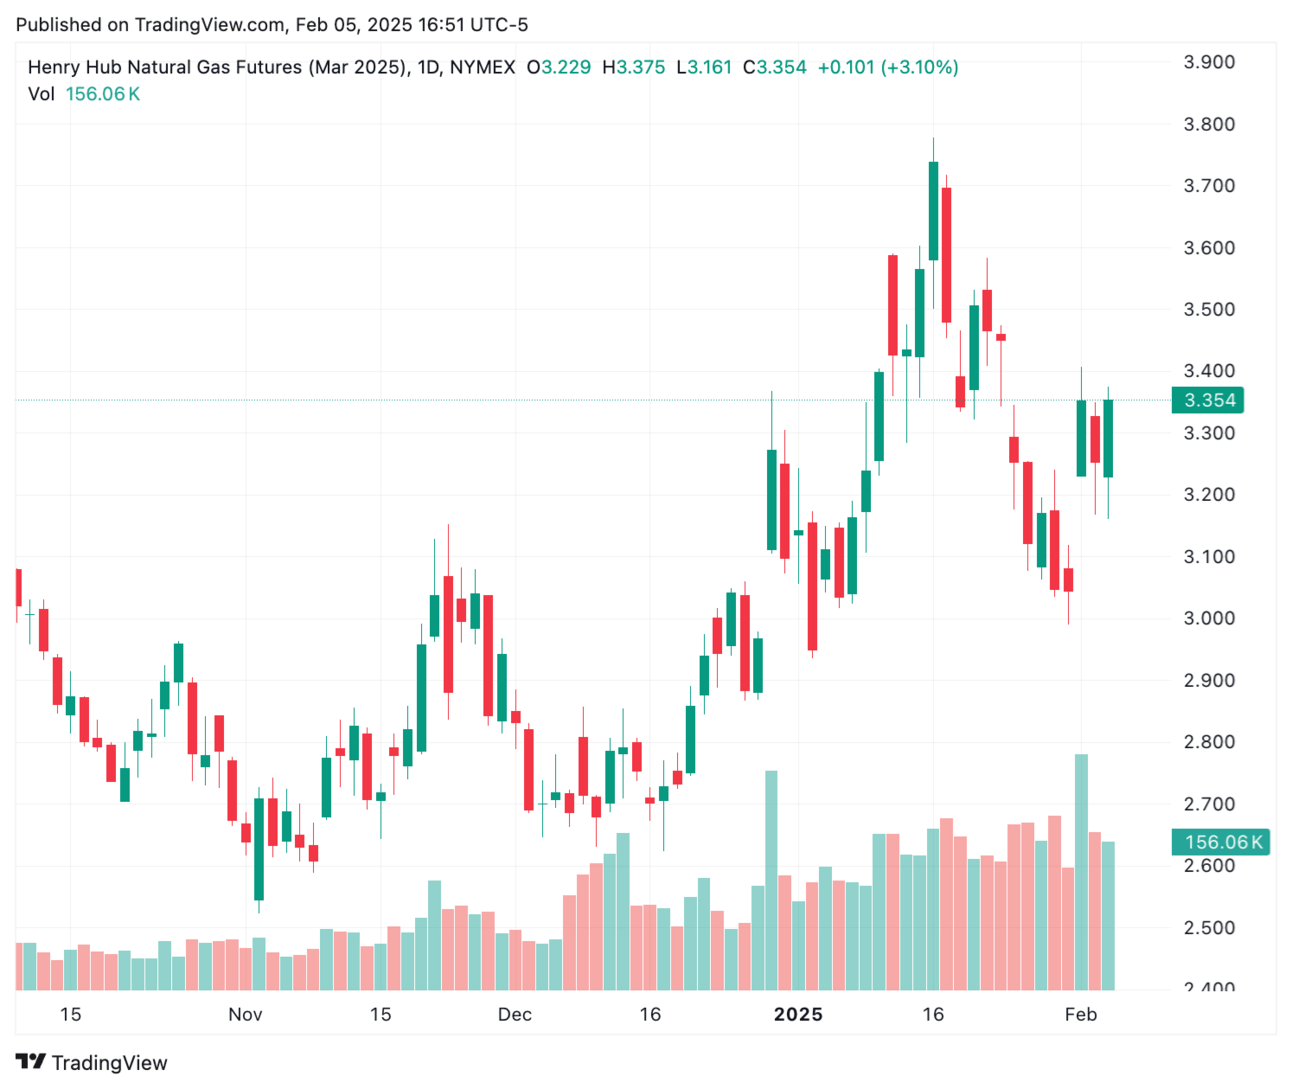
| Natural Gas (Mar) | $3.354 | +0.101 | +3.10% |
| Copper (Mar) | $4.4395 | +0.0860 | +1.95% |
| S&P 500 | 6,061.48 | +23.60 | +0.39% |
| Dollar Index (DXY) | 107.44 | -0.38 | -0.35% |
ENERGY MARKETS

🛢️Oil prices dropped 2.3% on a larger than expected inventory build. The EIA reported a build of 8.7 million barrels versus consensus estimates of 2.0 million.
Gasoline built by 2.2 million barrels and distillates declined by 5.5 million.
OPEC+ Production Declines
A Reuters survey showed that OPEC+ production declined by 50,000 bpd in January to 26.53 bpd.
Export declines in Iran and Nigeria were partially offset by increases in the UAE as field maintenance ended.
WTI Spreads
The backwardation in the front spread continues to evaporate as WTI shows inventory builds after weeks of declines. If you remember, the Feb/March spread briefly went into contango before it rolled off.
Mar/Apr: +0.29
Mar/Dec: +3.80
Dec5/Dec6: +2.31

🔥Natural gas ended higher by 3.1% as mid-February demand continues to look on the strong side. However, the market is just waiting for stronger confirmation as that period gets closer.
EIA inventories are due out later today. Expectations are for a draw of 170 bcf which would continue the trend below recent averages.
PRESENTED BY ENERGY 101
How the Energy Industry Works

“ Although I’m not an engineer, the course gave me many useful tools to understand the technicalities of the industry. Now I can communicate easily with my contacts in the energy sector.
A LONG LOOK

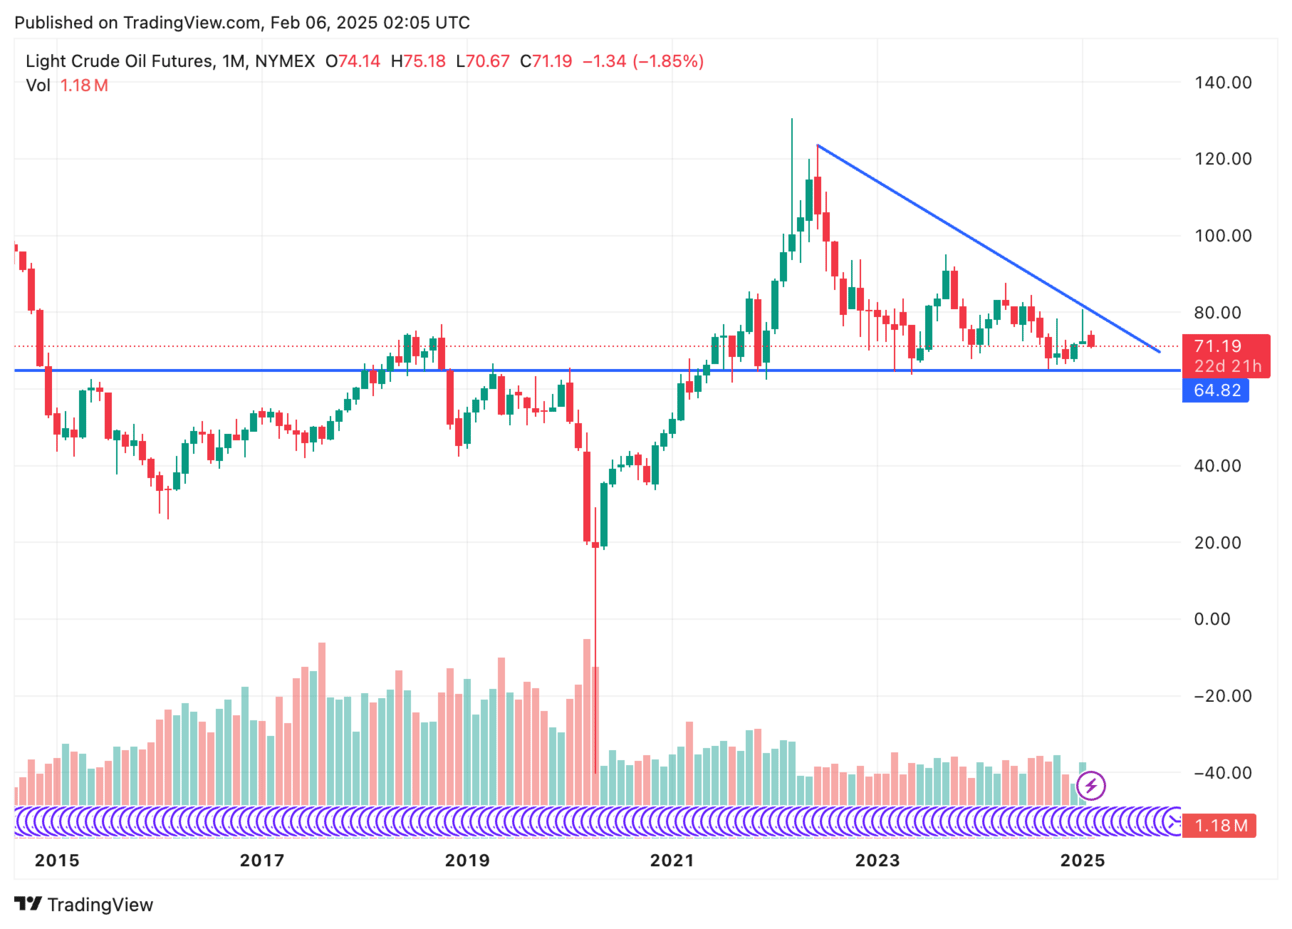
I stole this chart idea from the excellent ‘market vibes’ newsletter on substack. The writer is an ex-floor trader and has amazing stories of the open-outcry days (which I was lucky enough to get to experience) to go along with his analysis.
Highly recommend!
It is a premium newsletter and covers a lot more than just energy, but yesterday’s post offered a lot for free on oil in particular.
The moral of the story is that the $65 dollar level is critical technical support going back years, and the market has been failing to make new highs for the last 3 years.
Something to watch.
Also noted was that it is the time of year when crude inventories build as winter wanes and refineries go into maintenance before the summer gasoline season.
Adds up to weakening technicals, building inventories, collapsing front spread…
HEADLINES
“The problem has arisen because the previous government’s regime was found to be unlawful. The new applications will have to pass the new regime but our position on existing fields is very clear: we support them.”
+Starmer wants contentious North Sea oil and gas fields to go ahead - FT
"We'll reduce our investment programme towards 2030 through a stricter, more value-focused approach to capital allocation. We do this to ensure a stronger balance sheet,"
+Orsted slashes 2030 investment program by 25% - Reuters
ECONOMIC CALENDAR
Monday - PMI, ISM
Tuesday - Job Openings, Factory Orders, Fed Atlanta & San Fran speak,
Wednesday - ADP Employment, Crude Oil Storage Report
Thursday - Natural Gas Storage Report, Jobless Claims, Fed speakers
Friday - Employment
